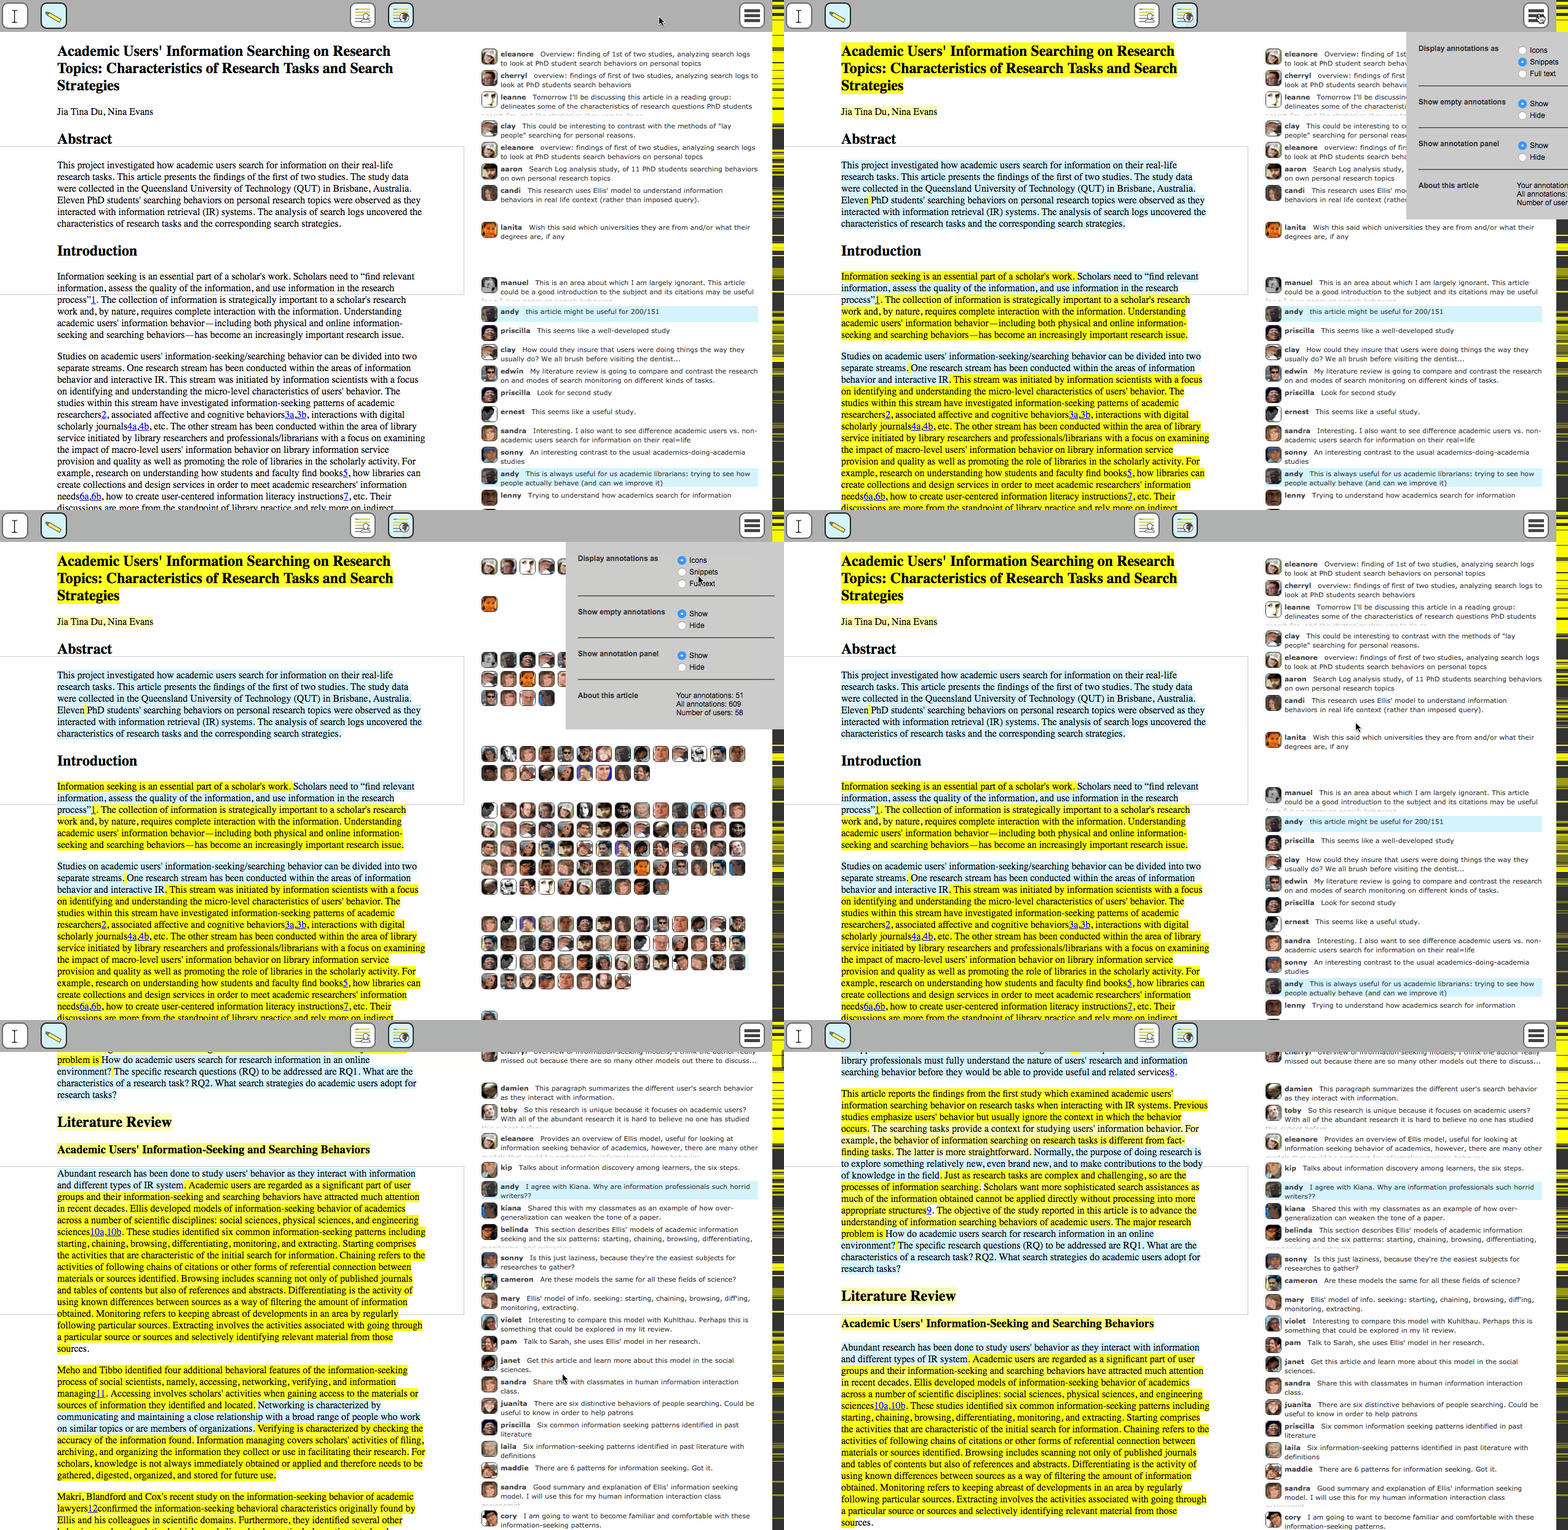
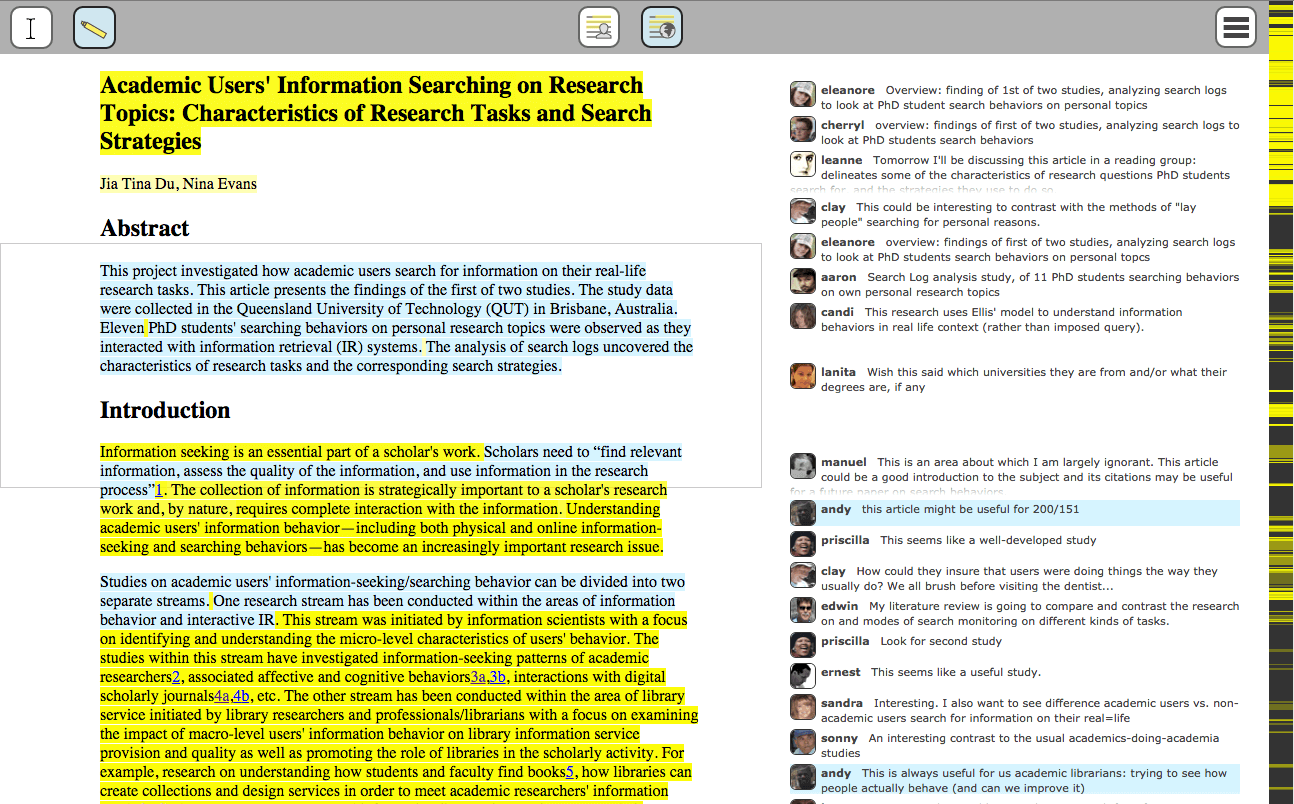
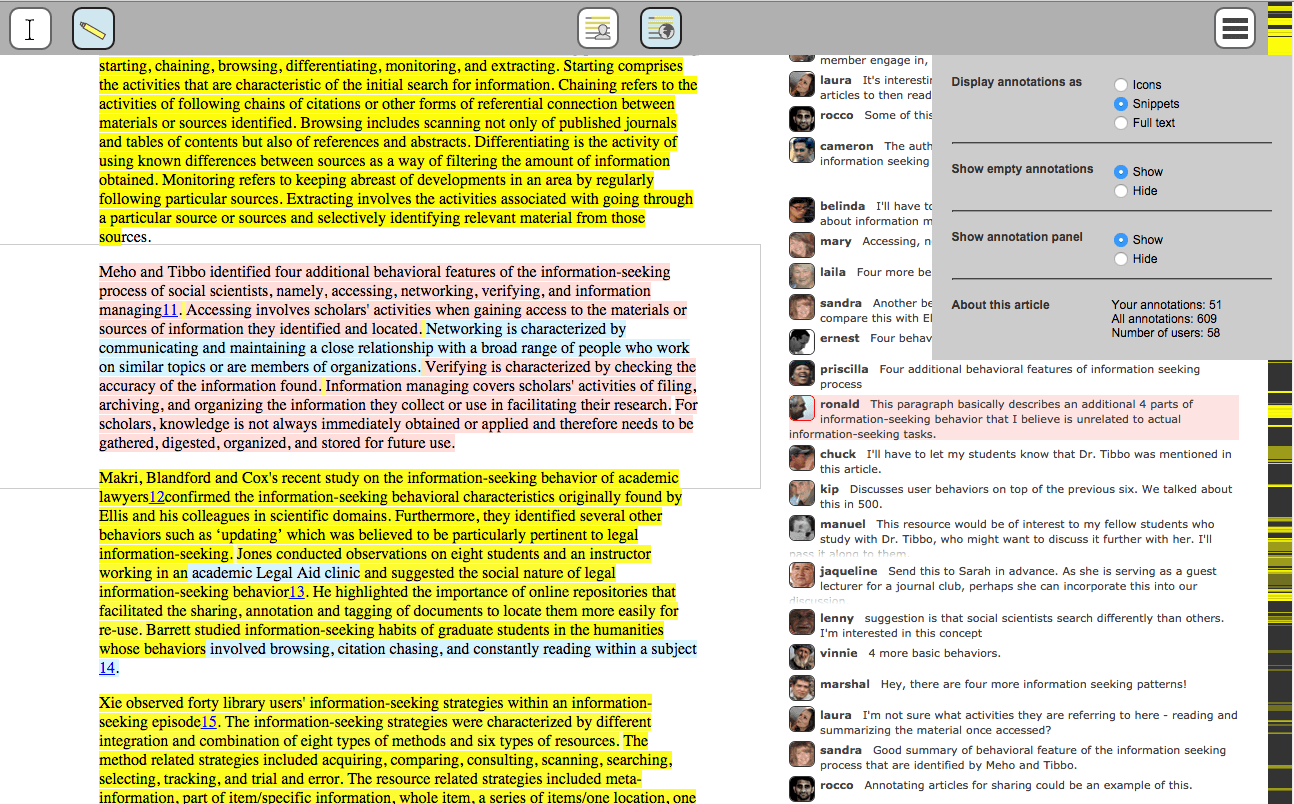
As part of my research assistantship at UNC, I worked on improving the prototype of a "web scale" annotations project started by a previous student. The project was mainly used in conducting user research studies. Various iterations of the application were required for user testing, so I worked on several different versions of the application's UI.

Prototyping
The application itself was a collection of research articles with annotations stored in a CouchDB database. The back-end was Python, using the Flask micro framework. The UI was HTML, CSS, and JavaScript, built on top of the AnnotatorJS library. I created a means of accessing variations of the UI based on query string values—effectively a set of feature flags before I knew that concept had a name!

Visual Design
Being a novel interface, the Annotator One prototype required icons to convey to users some complex concepts such as "show all my highlights" or "show everyone's highlights". I created custom icons for the prototype that were intended to convey showing/hiding highlights as well as determing whose highlights you were seeing. You can see these icons in the accompanying screenshots, in the top nav bar.

Performance Tuning
A big challenge with "web scale" annotations is the sheer number of annotations on a single text. All of these highlights and comments can easily bog down the performance of a web application. Some of my effort on the Annotator One project was directed towards improving performance of the interface, usually through optimizing DOM manipulations involved in showing all the annotations on page load.
Article text loaded from the server, but the annotation text loaded asynchronously from a CouchDB database. Some of the performance tuning things I worked on included refactoring DOM manipulations to not happen in loops, comparing the speed of Canvas and DOM representations of a highlights "heat map" (the vertical strip on the right side the screen), and firing events on scroll without bogging down the UI.